


.jpg)

Solar Activity Reports
Announcement
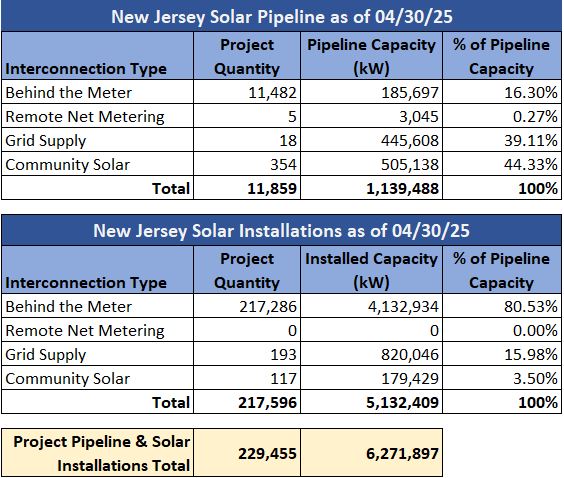
New Jersey Surpasses the 5 GW Solar Energy Milestone.
Click here for the NJBPU Press Release, dated 01/23/25.
New Jersey's Clean Energy Program solar activity reports provide detailed information for all solar projects that are installed and currently under development in New Jersey.
Solar activity reports and data are posted on the fourth Wednesday of every month at 2:00pm EST for the previous reporting month.
| Monthly Solar Activity Reporting |
| through, April 30, 2025 |
The following reports and data include current monthly solar activity for all solar projects in the SRP, TI, ADI, CSEP and CSI programs:
![]()
Quarterly Equipment Data through, March 31, 2025
Equipment data is posted quarterly for all solar projects through quarter ending, September 30, December 31, March 31 and June 30.
Archive Directory
The following archive directories include all solar data for previous reporting months:
- May 2016 thru current YTD
- Prior to May 2016 (managed by previous program manager, Honeywell)
Subscribe to the Renewable Energy listserv to receive information and other program updates.